9:00 AM :
Giới thiệu Chương trình sự kiện - Mr. Stevent (MC)

Heart of Nature Research and Development
Acre, Inc. Laboratory and Greenhouse, Tucson,...
ACRE Inc. Tucson Laboratory, May 3, 2021
CTI Dairy Compost sample was received on April...
ACRE Inc. Tucson, Arizona Laboratory and Greenhouse
June 22, 2021
Objective:
The...
ACRE Inc. Tucson, AZ Laboratory and Greenhouse
May 27, 2021
Objective:
This trial...
Heart of Nature Research and Development
Acre, Inc. Laboratory and Greenhouse, Tucson, Arizona
April 12, 2021
Background:
SKMHUF and Alga K18 are products that can be applied to foliage to increase growth and ultimately yield. SKMUF has been reported to be effective when applied to corn and other crops. Alga K18 has proven to increase yields of nuts of pecan and almond trees. Alga K18 has also been shown to increase the flower size of cannabis plants. Previous studies with Alga K18 indicated that it was not effective when applied at 10 gallons per acre to plant foliage or to the seed furrow. This research was designed to determine the value of SKMUF and Alga K18 when applied to foliage separately and together. (Note that the previous evidence using Alga K18 indicates that 10 gallons per acre of total solution per acre is not an effective rate for 1 lb. and greater applications per acre.)
Materials and Methods:
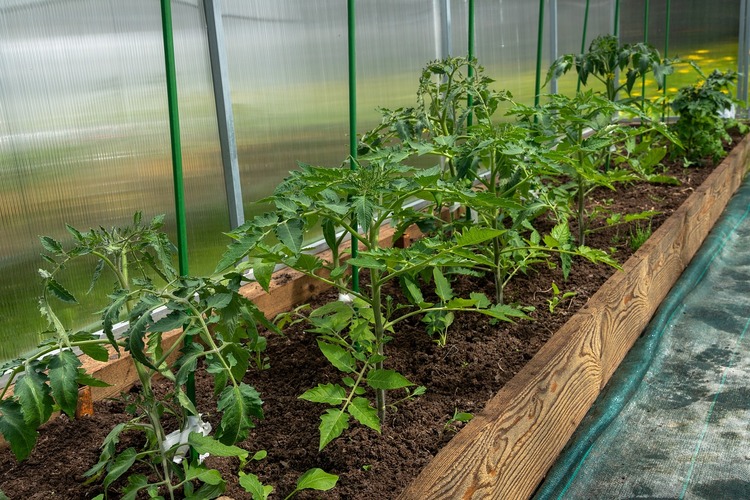
Tomato plants with 4-5 true leaves were transplanted on March 22, 2021, in one-gallon containers that contained a soilless medium: peat moss (20%), wood chips (20%), pumice (60%) mix. This mixture has been used in previous experiments. Untreated check (UTC) plants were sprayed with water at approximately 10 gallons per acre. The foliage of treated plants was sprayed approximately 10 gallons per acre with 1 lb., 2.5. lb. and 5 lb. of SKMUF alone, or Alga K18 alone, all at equivalent rates per acre. SKMUF and Alga K18 were applied together at rates equal to 1 lb., 2.5 lb., and 5 lb. of each product. All treatments and the UTC consisted of 4 replications equaling at total of 40 tomato plants.
Results:
On March 9, 2021 plants were removed from containers, roots were washed and dried. Plant shoot heights and fresh weights of roots and shoots were determined. Average heights and weights were calculated for all treatments and the UTC.
Table 1. Tomato Plants Heights, Root and Shoot Fresh Weights from Foliar Applications of SKMUF and Alga K18 Applied Separately and in Mixtures
| Treatments | Av. Ht.(in) | Root Wt. (g) | Shoot Wt.(g) | Total Wt. (g) |
| UTC | 16.4 | 8.52 | 45.01 | 53.53 |
| SKMUF, 1.0 lb. | 24.75 | 16.20 | 84.08 | 100.28 |
| SKMUF, 2.5 lb. | 24.56 | 14.75 | 65.10 | 79.85 |
| SKMU, 5.0 lb. | 24.68 | 11.11 | 66.77 | 77.88 |
| Alga K18, 1.0 lb. | 24.56 | 10.53 | 59.32 | 69.85 |
| Alga K18, 2.5 lb. | 23.08 | 11.03 | 58.26 | 69.30 |
| Alga K18, 5.0 lb. | 23.00 | 17.97 | 51.47 | 69.45 |
| SKMUF + Alga K18, 1.0 + 1.0 lb. | 23.00 | 11.71 | 52.61 | 64.32 |
| SKMUF + Alga K18, 2.5 + 2.5 lb. | 21.19 | 11.76 | 50.34 | 62.10 |
| SKMUF + Alga K18, 5.0 + 5.0 lb. | 22.06 | 12.35 | 55.84 | 68.19 |
Page 2, April 12, 2021, SKMUF and Alga K18 Treatments of Tomato Plants
SKMUF at 1.0 lb. per acre increased total growth as compared to all other treatments. SKMUF at 5 lb. per acre causes some minor leaf necrosis.
All treatments increased tomato plant growth compared to the UTC.
All treatments and the UTC consisted for 4 plants, except for treatments of Alga K18 at equivalent rates per acre 2.5 and 5 lb. that consisted of 3 plants per treatment.
Conclusions
SKMUF (20 microns minus) alone provided the most growth of tomato plants and should be used alone. Mixtures with other plant nutrients may be required to ensure that no phytotoxicity occurs from tank mixes with foliar fertilizers and other products. Small tests are needed prior to application of SKMUF with other nutrients and other materials.
SKMUF test results indicate that it has very high activity when applied to foliage.
All treatments Alga K18 combined with SKMUF did increase growth but is not of value at these rates compared to SKMUF.
Future Trials
SKMUF will be tested as in-furrow treatments for determination of pepper and corn seed germination and growth.
Alga K18 in typically used at higher water volumes that have been demonstrated to be effective when applied to foliage of pecan and almond trees.
ACRE Inc. Tucson Laboratory, May 3, 2021
CTI Dairy Compost sample was received on April 27, 2021.
Objective:
Determine the pH change from blending SKMAG with three different compost samples.
Materials and Methods:
SKMAG was quantitatively blended with three compost samples at rates of 1:4, 1:5, and 1:6, i.e. SKMAG: CTI compost. The pH values were measured after equilibration durations of 1 hour, 24 hours, and 48 hours.
Table 1. The pH from SKMAG Blended at Three Rates with CTI Dairy Compost
| Replications | pH @ 1 hr | Average | pH @ 24 hrs | Average | pH @ 48 hrs | Average |
| UTC #1 | 9.10 | 9.02 | 8.67 | 8.62 | 8.57 | 8.61 |
| UTC #2 | 9.00 | 8.63 | 8.65 | |||
| UTC #3 | 8.95 | 8.56 | 8.61 | |||
| 1:4 #1 | 8.15 | 8.28 | 8.00 | 8.04 | 8.10 | 8.13 |
| 1:4 #2 | 8.31 | 8.00 | 8.10 | |||
| 1:4 #3 | 8.38 | 8.11 | 8.18 | |||
| 1:5 #1 | 8.64 | 8.58 | 8.26 | 8.28 | 8.28 | 8.32 |
| 1:5 #2 | 8.46 | 8.24 | 8.32 | |||
| 1:5 #3 | 8.63 | 8.34 | 8.37 | |||
| 1:6 #1 | 8.66 | 8.59 | 8.03 | 8.19 | 8.43 | 8.37 |
| 1:6 #2 | 8.47 | 8.15 | 8.20 | |||
| 1:6 #3 | 8.64 | 8.39 | 8.47 |
ACRE Inc. Tucson, Arizona Laboratory and Greenhouse
June 22, 2021
Objective:
The objective of these trials was to determine the corn plant response in soil amended with compost and SKMAG tilled into six inches of soil.
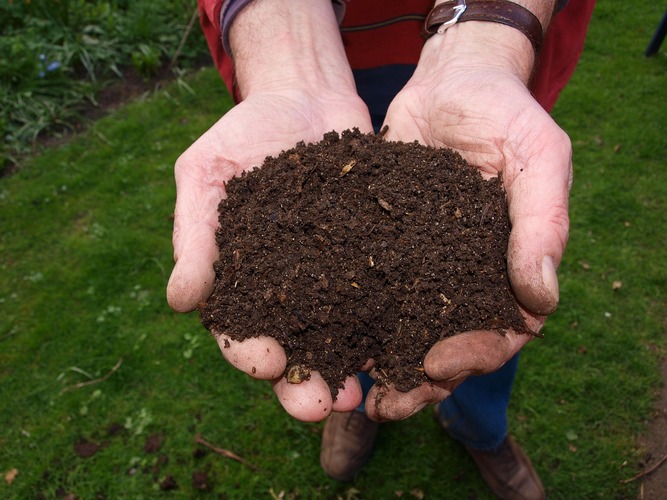
Materials and Methods: Dyna-Gro hybrid corn seeds, variety A1034226, were seeded in previously tested agriculture soil (Curry soil). One gallon containers were filled six inches deep, four replications per treatment and the UTC. Treatments were comprised of compost alone, SKMAG alone, and SKMAG plus compost (Source: Scotts Valley, CA) The UTC’s consisted of only Curry soil.
The ratio of SKMAG to compost is 1 ton per 5 tons, respectively. Equivalent acre rates of compost were 6,000 lbs. and SKMAG at 1,200 lbs, equaling a total of 7,200 lbs total added per acre.
Soil and compost mixtures were made in a wheelbarrow prior to filling one gallon containers to obtain uniform distribution in the soil. Mixtures of soil and compost, SKMAG only and soil only represented the treatments. (Re: Tables 1, 2, 3, 4) Soil was irrigated as needed. Plants were grown for 35 days. Roots were gently rinsed and blotted dry. Metrics were heights, fresh weights of roots and shoots and total weights.
Results:
Table 1. Corn Plants from Untreated Check
Height (inches) | Average | Root Weight (grams) | Average | Shoot Weight (grams) | Average | Total Weight (grams) | Average |
| 24.75 | 25.31 | 3.53 | 4.65 | 9.28 |
11.60 | 12.81 | 16.25 |
| 28.5 | 6.66 | 14.32 | 20.98 | ||||
| 23.5 | 3.21 | 8.80 | 12.01 | ||||
| 24.5 | 5.19 | 14.01 | 19.20 |
Table 2. Corn Plants from Application of SKMAG
Height (inches) | Average | Root Weight (grams) | Average | Shoot Weight (grams) | Average | Total Weight (grams) | Average |
| 23.75 |
24.31 | 2.46 |
4.53 | 9.40 |
10.55 | 11.86 |
15.08 |
| 23.25 | 3.04 | 8.61 | 11.65 | ||||
| 27.25 | 7.76 | 15.13 | 22.80 | ||||
| 23 | 4.96 | 9.06 | 14.02 |
Table 3. Corn Plant from Application of Compost
Height (inches) | Average | Root Weight (grams) | Average | Shoot Weight (grams) | Average | Total Weight (grams) | Average |
| 22.25 |
22.94 | 4.94 |
6.20 | 9.43 |
10.69 | 14.37 |
16.89 |
| 23 | 4.38 | 8.61 | 12.99 | ||||
| 23.25 | 9.41 | 13.55 | 22.96 | ||||
| 23.25 | 6.06 | 11.18 | 17.24 |
Table 4. Corn Plant from Application of SKMAG Plus Compost
Height (inches) | Average | Root Weight (grams) | Average | Shoot Weight (grams) | Average | Total Weight (grams) | Average |
| 25.25 |
26.50 | 5.46 |
6.01 | 14.28 |
13.81 | 19.74 |
19.81 |
| 23.75 | 4.99 | 9.61 | 14.60 | ||||
| 28.25 | 6.96 | 15.15 | 22.11 | ||||
| 28.75 | 6.62 | 16.18 | 22.80 |
SKMAG plus compost increased corn plant height and total fresh more that other treatments and the UTC. SKMAG alone was similar to the UTC.
SKMAG has very high value when combined with compost. Note that composts and fertilizers are routinely used and compliment SKMAG applications.
ACRE Inc. Tucson, AZ Laboratory and Greenhouse
May 27, 2021
Objective:
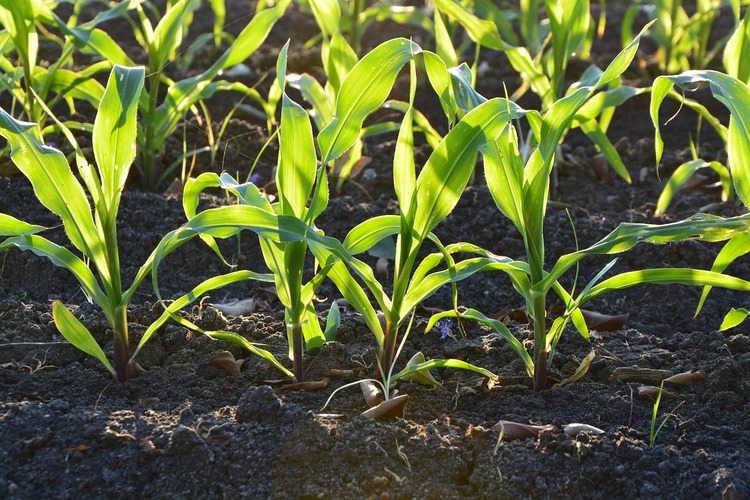
This trial was designed to determine the germination and growth rates of corn seeds planted in-furrow and treated with SKM Ultra Fine (SKMUF).
Materials and Methods:
Tubs 4” deep x 9.5” wide x 13” long were filled with agriculture soil (Curry soil) to a depth of 3.5”. Furrows were 12” long and 1.5” deep. On April 16, 2021, six corn seeds were placed in each furrow and the SKMUF was added to the top of the seeds at ½ lb/ acre and 1 lb/ acre rate. The furrows were then covered with soil and tubs were watered to field capacity and watered as needed during the trial. Treatments and untreated checks (UTCs) consisted of 3 replications of six plants each.
Results:
Table 1: Average growth metrics for Untreated Checks
| Treatment | Height (inches) | Root Weight (grams) | Shoot Weight (grams) | Total Weight (grams) |
| UTC #1 | 18.75 | 2.85 | 4.51 | 7.36 |
| UTC #2 | 22.5 | 3.16 | 7.81 | 10.97 |
| UTC #3 | 19.5 | 4.26 | 6.10 | 10.36 |
Total fresh weight average- 9.56 g.
Table 2: Average growth metrics for SKMUF at ½ lb / Acre
| Treatment | Height (inches) | Root Weight (grams) | Shoot Weight (grams) | Total Weight (grams) |
| Rep #1 | 17.54 | 3.27 | 4.76 | 8.03 |
| Rep #2 | 15.92 | 4.11 | 4.43 | 8.54 |
| Rep #3 | 15.5 | 2.33 | 3.55 | 5.87 |
Total fresh weight average- 7.48 g
Table 3: Average growth metrics for SKMUF at 1 lb / Acre
| Treatment | Height (inches) | Root Weight (grams) | Shoot Weight (grams) | Total Weight (grams) |
| Rep #1 | 21.92 | 4.12 | 7.33 | 11.44 |
| Rep #2 | 16.71 | 2.78 | 4.31 | 7.09 |
| Rep #3 | 17.46 | 4.41 | 5.41 | 9.82 |
Total fresh weight average- 9.45 g.
At the two rates of SKMUF, there was no increase in growth. This is consistent with previous trials. (A second trial is underway using Anaheim pepper seeds.)

Heart of Nature Research and Development
Acre, Inc. Laboratory and Greenhouse, Tucson, Arizona
April 12, 2021
Background:
SKMHUF and Alga K18 are products that can be applied to foliage to increase growth and ultimately yield. SKMUF has been reported to be effective when applied to corn and other crops. Alga K18 has proven to increase yields of nuts of pecan and almond trees. Alga K18 has also been shown to increase the flower size of cannabis plants. Previous studies with Alga K18 indicated that it was not effective when applied at 10 gallons per acre to plant foliage or to the seed furrow. This research was designed to determine the value of SKMUF and Alga K18 when applied to foliage separately and together. (Note that the previous evidence using Alga K18 indicates that 10 gallons per acre of total solution per acre is not an effective rate for 1 lb. and greater applications per acre.)
Materials and Methods:
Tomato plants with 4-5 true leaves were transplanted on March 22, 2021, in one-gallon containers that contained a soilless medium: peat moss (20%), wood chips (20%), pumice (60%) mix. This mixture has been used in previous experiments. Untreated check (UTC) plants were sprayed with water at approximately 10 gallons per acre. The foliage of treated plants was sprayed approximately 10 gallons per acre with 1 lb., 2.5. lb. and 5 lb. of SKMUF alone, or Alga K18 alone, all at equivalent rates per acre. SKMUF and Alga K18 were applied together at rates equal to 1 lb., 2.5 lb., and 5 lb. of each product. All treatments and the UTC consisted of 4 replications equaling at total of 40 tomato plants.
Results:
On March 9, 2021 plants were removed from containers, roots were washed and dried. Plant shoot heights and fresh weights of roots and shoots were determined. Average heights and weights were calculated for all treatments and the UTC.
Table 1. Tomato Plants Heights, Root and Shoot Fresh Weights from Foliar Applications of SKMUF and Alga K18 Applied Separately and in Mixtures
| Treatments | Av. Ht.(in) | Root Wt. (g) | Shoot Wt.(g) | Total Wt. (g) |
| UTC | 16.4 | 8.52 | 45.01 | 53.53 |
| SKMUF, 1.0 lb. | 24.75 | 16.20 | 84.08 | 100.28 |
| SKMUF, 2.5 lb. | 24.56 | 14.75 | 65.10 | 79.85 |
| SKMU, 5.0 lb. | 24.68 | 11.11 | 66.77 | 77.88 |
| Alga K18, 1.0 lb. | 24.56 | 10.53 | 59.32 | 69.85 |
| Alga K18, 2.5 lb. | 23.08 | 11.03 | 58.26 | 69.30 |
| Alga K18, 5.0 lb. | 23.00 | 17.97 | 51.47 | 69.45 |
| SKMUF + Alga K18, 1.0 + 1.0 lb. | 23.00 | 11.71 | 52.61 | 64.32 |
| SKMUF + Alga K18, 2.5 + 2.5 lb. | 21.19 | 11.76 | 50.34 | 62.10 |
| SKMUF + Alga K18, 5.0 + 5.0 lb. | 22.06 | 12.35 | 55.84 | 68.19 |
Page 2, April 12, 2021, SKMUF and Alga K18 Treatments of Tomato Plants
SKMUF at 1.0 lb. per acre increased total growth as compared to all other treatments. SKMUF at 5 lb. per acre causes some minor leaf necrosis.
All treatments increased tomato plant growth compared to the UTC.
All treatments and the UTC consisted for 4 plants, except for treatments of Alga K18 at equivalent rates per acre 2.5 and 5 lb. that consisted of 3 plants per treatment.
Conclusions
SKMUF (20 microns minus) alone provided the most growth of tomato plants and should be used alone. Mixtures with other plant nutrients may be required to ensure that no phytotoxicity occurs from tank mixes with foliar fertilizers and other products. Small tests are needed prior to application of SKMUF with other nutrients and other materials.
SKMUF test results indicate that it has very high activity when applied to foliage.
All treatments Alga K18 combined with SKMUF did increase growth but is not of value at these rates compared to SKMUF.
Future Trials
SKMUF will be tested as in-furrow treatments for determination of pepper and corn seed germination and growth.
Alga K18 in typically used at higher water volumes that have been demonstrated to be effective when applied to foliage of pecan and almond trees.
ACRE Inc. Tucson Laboratory, May 3, 2021
CTI Dairy Compost sample was received on April 27, 2021.
Objective:
Determine the pH change from blending SKMAG with three different compost samples.
Materials and Methods:
SKMAG was quantitatively blended with three compost samples at rates of 1:4, 1:5, and 1:6, i.e. SKMAG: CTI compost. The pH values were measured after equilibration durations of 1 hour, 24 hours, and 48 hours.
Table 1. The pH from SKMAG Blended at Three Rates with CTI Dairy Compost
| Replications | pH @ 1 hr | Average | pH @ 24 hrs | Average | pH @ 48 hrs | Average |
| UTC #1 | 9.10 | 9.02 | 8.67 | 8.62 | 8.57 | 8.61 |
| UTC #2 | 9.00 | 8.63 | 8.65 | |||
| UTC #3 | 8.95 | 8.56 | 8.61 | |||
| 1:4 #1 | 8.15 | 8.28 | 8.00 | 8.04 | 8.10 | 8.13 |
| 1:4 #2 | 8.31 | 8.00 | 8.10 | |||
| 1:4 #3 | 8.38 | 8.11 | 8.18 | |||
| 1:5 #1 | 8.64 | 8.58 | 8.26 | 8.28 | 8.28 | 8.32 |
| 1:5 #2 | 8.46 | 8.24 | 8.32 | |||
| 1:5 #3 | 8.63 | 8.34 | 8.37 | |||
| 1:6 #1 | 8.66 | 8.59 | 8.03 | 8.19 | 8.43 | 8.37 |
| 1:6 #2 | 8.47 | 8.15 | 8.20 | |||
| 1:6 #3 | 8.64 | 8.39 | 8.47 |
ACRE Inc. Tucson, Arizona Laboratory and Greenhouse
June 22, 2021
Objective:
The objective of these trials was to determine the corn plant response in soil amended with compost and SKMAG tilled into six inches of soil.
Materials and Methods: Dyna-Gro hybrid corn seeds, variety A1034226, were seeded in previously tested agriculture soil (Curry soil). One gallon containers were filled six inches deep, four replications per treatment and the UTC. Treatments were comprised of compost alone, SKMAG alone, and SKMAG plus compost (Source: Scotts Valley, CA) The UTC’s consisted of only Curry soil.
The ratio of SKMAG to compost is 1 ton per 5 tons, respectively. Equivalent acre rates of compost were 6,000 lbs. and SKMAG at 1,200 lbs, equaling a total of 7,200 lbs total added per acre.
Soil and compost mixtures were made in a wheelbarrow prior to filling one gallon containers to obtain uniform distribution in the soil. Mixtures of soil and compost, SKMAG only and soil only represented the treatments. (Re: Tables 1, 2, 3, 4) Soil was irrigated as needed. Plants were grown for 35 days. Roots were gently rinsed and blotted dry. Metrics were heights, fresh weights of roots and shoots and total weights.
Results:
Table 1. Corn Plants from Untreated Check
Height (inches) | Average | Root Weight (grams) | Average | Shoot Weight (grams) | Average | Total Weight (grams) | Average |
| 24.75 | 25.31 | 3.53 | 4.65 | 9.28 |
11.60 | 12.81 | 16.25 |
| 28.5 | 6.66 | 14.32 | 20.98 | ||||
| 23.5 | 3.21 | 8.80 | 12.01 | ||||
| 24.5 | 5.19 | 14.01 | 19.20 |
Table 2. Corn Plants from Application of SKMAG
Height (inches) | Average | Root Weight (grams) | Average | Shoot Weight (grams) | Average | Total Weight (grams) | Average |
| 23.75 |
24.31 | 2.46 |
4.53 | 9.40 |
10.55 | 11.86 |
15.08 |
| 23.25 | 3.04 | 8.61 | 11.65 | ||||
| 27.25 | 7.76 | 15.13 | 22.80 | ||||
| 23 | 4.96 | 9.06 | 14.02 |
Table 3. Corn Plant from Application of Compost
Height (inches) | Average | Root Weight (grams) | Average | Shoot Weight (grams) | Average | Total Weight (grams) | Average |
| 22.25 |
22.94 | 4.94 |
6.20 | 9.43 |
10.69 | 14.37 |
16.89 |
| 23 | 4.38 | 8.61 | 12.99 | ||||
| 23.25 | 9.41 | 13.55 | 22.96 | ||||
| 23.25 | 6.06 | 11.18 | 17.24 |
Table 4. Corn Plant from Application of SKMAG Plus Compost
Height (inches) | Average | Root Weight (grams) | Average | Shoot Weight (grams) | Average | Total Weight (grams) | Average |
| 25.25 |
26.50 | 5.46 |
6.01 | 14.28 |
13.81 | 19.74 |
19.81 |
| 23.75 | 4.99 | 9.61 | 14.60 | ||||
| 28.25 | 6.96 | 15.15 | 22.11 | ||||
| 28.75 | 6.62 | 16.18 | 22.80 |
SKMAG plus compost increased corn plant height and total fresh more that other treatments and the UTC. SKMAG alone was similar to the UTC.
SKMAG has very high value when combined with compost. Note that composts and fertilizers are routinely used and compliment SKMAG applications.
ACRE Inc. Tucson, AZ Laboratory and Greenhouse
May 27, 2021
Objective:
This trial was designed to determine the germination and growth rates of corn seeds planted in-furrow and treated with SKM Ultra Fine (SKMUF).
Materials and Methods:
Tubs 4” deep x 9.5” wide x 13” long were filled with agriculture soil (Curry soil) to a depth of 3.5”. Furrows were 12” long and 1.5” deep. On April 16, 2021, six corn seeds were placed in each furrow and the SKMUF was added to the top of the seeds at ½ lb/ acre and 1 lb/ acre rate. The furrows were then covered with soil and tubs were watered to field capacity and watered as needed during the trial. Treatments and untreated checks (UTCs) consisted of 3 replications of six plants each.
Results:
Table 1: Average growth metrics for Untreated Checks
| Treatment | Height (inches) | Root Weight (grams) | Shoot Weight (grams) | Total Weight (grams) |
| UTC #1 | 18.75 | 2.85 | 4.51 | 7.36 |
| UTC #2 | 22.5 | 3.16 | 7.81 | 10.97 |
| UTC #3 | 19.5 | 4.26 | 6.10 | 10.36 |
Total fresh weight average- 9.56 g.
Table 2: Average growth metrics for SKMUF at ½ lb / Acre
| Treatment | Height (inches) | Root Weight (grams) | Shoot Weight (grams) | Total Weight (grams) |
| Rep #1 | 17.54 | 3.27 | 4.76 | 8.03 |
| Rep #2 | 15.92 | 4.11 | 4.43 | 8.54 |
| Rep #3 | 15.5 | 2.33 | 3.55 | 5.87 |
Total fresh weight average- 7.48 g
Table 3: Average growth metrics for SKMUF at 1 lb / Acre
| Treatment | Height (inches) | Root Weight (grams) | Shoot Weight (grams) | Total Weight (grams) |
| Rep #1 | 21.92 | 4.12 | 7.33 | 11.44 |
| Rep #2 | 16.71 | 2.78 | 4.31 | 7.09 |
| Rep #3 | 17.46 | 4.41 | 5.41 | 9.82 |
Total fresh weight average- 9.45 g.
At the two rates of SKMUF, there was no increase in growth. This is consistent with previous trials. (A second trial is underway using Anaheim pepper seeds.)
America boasts the world's most advanced...

The leading U.S. agricultural exports are grains and feeds, soybeans, livestock...
The Origins and Evolution of Organic Agriculture
The concept of organic...
America boasts the world's most advanced and modern agricultural industry. Agricultural laborers make up around 1% of the 322 million-person population. In terms of the labor force, agricultural workers in the United States accounted for only 0.7% of the total US employment in 2014 (155,421,000 individuals).
The total area of the United States is 9,161,923 km2, with cultivable land accounting for 18.1%. According to US Department of Agriculture statistics, the US had 2,109,363 total farms in February 2014, with an average area of 174 hectares per farm.
In 2012, the overall value of agricultural products reached 394.6 billion USD, a 33% increase over 2007, with crop products accounting for 219.6 billion USD and livestock products accounting for 171.7 billion USD.
The United States is the world's top importer and exporter of agricultural products, accounting for an estimated 18% of global agricultural trade. From 1960 to 2014, the United States consistently had a trade surplus in agriculture items. Agricultural exports, for example, were anticipated to reach 149.5 billion USD in 2014, accounting for more than 10% of the total export turnover of all products, and the agricultural trade surplus was more than 38.5 billion USD.
Below are some reasons why America has such a small percentage of farmers compared to the total workforce yet has such a powerful agricultural industry.
The agricultural industry in the United States has thrived as a result of the US government's agricultural development programs. From the outset, the government enacted a land law in 1862 that granted free land to those who came to live and work on vacant property in the American West, allowing some farmers to easily settle down and start a business.
The agricultural industry in the United States has thrived as a result of the US government's agricultural development programs. From the outset, the government enacted a land law in 1862 that granted free land to those who came to live and work on vacant property in the American West, allowing some farmers to easily settle down and start a business.
The Agricultural Development Service was established by the United States Congress in 1914 to advise farmers on the application of fertilizer and the subsequent stages of the process to increase agricultural output. The Ministry of Agriculture is in charge of innovative research, fertilizer production to boost grain yields, hybrid types for stronger plants, and treatments to preserve and cure plants and animals, disease prevention, and a variety of additional pest-control approaches.
President Herbert Hoover established a federal agricultural board in 1929 to protect farmers' economic security. In 1933, President Franklin D. Roosevelt authorized the installation of a price subsidy system for farmers at a price comparable to the market's regular stable conditions. Between 1933 and 1996, the government lent money to farmers for farming purposes, and farmers had the right to repay the debt at the price indicated in the contract. Furthermore, farmers had the right to sell surplus products to the government when agricultural prices were high, and to food trading companies when agricultural prices were low.
Furthermore, the government promotes programs to protect and nourish reserve land. Large-scale intervention in the agriculture industry in the United States persisted until the late 1990s. Following that, agricultural price subsidies remained modest, and the government concentrated on the strategic reserve program, natural disaster prevention, environmental protection, and scientific research in order to support the US agricultural industry successfully.
The government is currently focusing on agricultural exports and is particularly concerned about the sustainability of agricultural labor. The Senate recently passed an immigration measure aimed at ensuring that there are enough employees for agriculture, particularly during harvest season, livestock raising, and agricultural product production for export. This statute also allows persons working in the US agricultural industry who do not have valid documentation to come to the US.
It is due to these successful support measures that the US agricultural industry has achieved its current success.
From a historical standpoint, American farmers are viewed as self-sufficient, industrious, innovative, patient, and enthusiastic. At first, these farmers arrived in America with little, working on property they did not own.
In 1790, farmers comprised about 90% of the population in the United States. By 1920, American farmers accounted for 30.8% of the total population, by 1960, they accounted for 8.3%, and as of 2014, the estimated number of farmers Americans actually working on the fields accounted for only about 1% of the total American population.
These farmers own and operate small and medium-sized family farms or self-owned businesses, accounting for up to 95% of the total cultivated agricultural land area, with large corporations owning the remaining 5%.
American farmers are highly skilled in the use of machinery, have extensive understanding of agriculture and economics, and many hold university degrees. They have concentrated on upgrading farming and cattle-raising techniques, resulting in a significant boost in agricultural output. Today's image of the American farmer is that of an agricultural worker who often wears jeans and checkered shirts and resides in fully equipped apartments.
Agricultural laborers in the United States earn a good living; the current average compensation of an American agricultural worker is $61,000 per year. In 1960, the average income of a farming family was $4,654 per household. The average salary in 2012 was $108,814, an increase of 23.38 times over 52 years.
America places a specific emphasis on the mechanization of farming, which involves employing technology to replace human and animal labor. Machinery expenditures constitute a significant component of total investment costs in agricultural production. Mechanization involves not only increasing the number of machines in the field, but also focusing on combining features to build entire machines, such as merging tractors with plows and planting machines, or initiatives on machines that can farm in terrain that humans cannot.
Machines are used in almost every aspect of agricultural production, from tillage to planting, fertilizing, irrigating, and harvesting. Aerial spraying of insecticides is also employed by farmers, as is computer monitoring of harvest data. Farmers now often drive tractors with air-conditioned cabs, equipped with quick and expensive plows, cultivators, and harvesters.
It took four farmers at the turn of the twentieth century to produce enough food to feed ten people. Today, one American farmer can feed 100 Americans and 32 people in other nations across the world.
With a large amount of farmed land, the use of modern agricultural tools and techniques has resulted in a significant increase in labor productivity. Furthermore, while there are floods and droughts, there is generally enough rainwater, river water, and groundwater to support irrigation in water-stressed areas. The western area of the Central United States is rich in agricultural land. As a result, when visitors come to America, they often see large, green, expansive fields of maize, soybeans, wheat, oranges, and grass fields.
For the reasons stated above, the US agricultural industry has made great strides, playing an important role in the US economy by providing abundant food at low prices and creating more jobs in processing industries, machinery manufacturing, and agricultural export services to countries all over the world.
Source: General Information
The leading U.S. agricultural exports are grains and feeds, soybeans, livestock products, tree nuts, fruits, vegetables, and other horticultural products. The leading U.S. imports are horticultural and tropical products. Canada, Mexico, the European Union, and East Asia are major U.S. trade partners.
U.S. agricultural trade rose to record levels in 2021
Total U.S. agricultural trade rose to record levels in 2021. U.S. agricultural exports were valued at $177 billion in 2021, an 18 percent increase relative to 2020. Imports grew by almost 17 percent in 2021 to $171 billion. While the United States typically exports more agricultural goods by value than it imports, from 2012–21, imports grew more rapidly than exports (driven in part by strong domestic economic growth and consumer preferences for year-round produce selections).
U.S. agricultural export value increased to record high in 2021
The value of U.S. agricultural exports increased in 2021, driven by gains across all major commodity groups. As a share of total export value, the top 4 categories equally accounted for about 90 percent of total exports between 2017 and 2021. These categories include grains and feeds; oilseeds and products; animals (e.g. livestock and poultry), meats, and products; and horticultural products. The grains and feeds category recorded the largest year-to-year growth, increasing 40 percent from 2020 to $43 billion in 2021. The animals, meats, and products category followed this growth, growing 22 percent from 2020 to $39 billion in 2021.
Horticultural products drive total U.S. agricultural import growth
The value of U.S. agricultural imports grew by 17 percent in 2021 from 2020, with gains in all major commodity groups. Fifty-two percent of U.S. agricultural imports in 2021 were horticultural products, including fruits, vegetables, tree nuts, wine, spirits, essential oils, and nursery stock. Sugar and tropical products, such as coffee and cocoa, comprised 15 percent of agricultural imports in 2021. Other product groups—such as oilseeds, grains and feeds, and livestock and meats—also contributed to import growth from 2001 to 2021.
The top 5 U.S. agricultural trading partners accounted for 61 percent of U.S. agricultural exports in 2021
China was the largest market for U.S. agricultural exports in 2021, followed by Canada and Mexico. Exports to China grew 25 percent between 2020 and 2021, growing significantly following trade disputes between the United States and China that led to a steep reduction in oilseed exports (among other commodities) in 2018. Japan and the European Union are also among the top five agricultural trading partners with the United States. While their shares of U.S. exports have decreased since 2001, they remain the fourth and fifth largest export markets. The top five U.S. agricultural trading partners accounted for 61 percent of U.S. agricultural exports in 2021.
Canada and the European Union are the two largest suppliers of U.S. agricultural imports, followed by Mexico
Canada and Mexico are the United States' first and third largest suppliers of agricultural products (averaging $30.9 billion and $25.5 billion in 2017–21, respectively). Mexico supplied the United States with 31 percent of imported horticultural products including fruit, vegetables, and alcoholic beverages. Canada is also a source of horticultural products, as well as grains, and meats. The European Union is the second largest import source, accounting for $28.0 billion worth of U.S. agricultural imports in 2017–21, with horticultural products such as wine, spirits, and essential oils accounting for more than 60 percent the value. South America (led by Brazil, Chile, and Colombia) averaged $15.6 billion in U.S. imports from 2017–21, consisting largely of horticultural, sugar, and tropical products in which the region has a comparative or seasonal advantage.
East Asia and North America remain top regions for U.S. agricultural exports
From 2017 to 2021, East Asia and North America combined to account for 60 percent of U.S. agricultural exports. East Asia (led by China, Japan, and South Korea) was the largest market, with a collective 31 percent share. The top three commodity groups exported to East Asia include oilseeds, grains, and meats. The share of U.S. exports to Canada and Mexico has increased and accounted for 28 percent of world exports over the 5 years from 2017–21. Southeast Asia (led by the Philippines, Vietnam, and Indonesia) is the third largest regional destination, followed closely by the European Union.
Exports expand the market for U.S. agricultural products
The United States tends to export a higher share of non-manufactured products than manufactured products. Non-manufactured products include food grains such as rice and wheat, oilseeds—and tree nuts such as almonds. The United States exports a lower share of manufactured products—such as sweeteners, bakery products, and dairy products. The overall export share of U.S. agricultural production in 2021 was 20 percent, the level of which has remained relatively constant since 2001.
U.S. consumer preference for high-value products is reflected in imports
The U.S. share of agricultural consumption sourced from imports tends to be higher for higher-value agricultural product groups. This higher share is due to numerous factors—including the relative competitiveness in production, seasonal availability, consumer preferences, and others. Sweeteners, and processed sugar, and confections are groups of products where the United States is reliant on imports. Fruits, nuts, and vegetables are also frequently imported. The United States tends to have a lower reliance on imports for unprocessed commodities such as feed grains, livestock, and oilseeds. The total import share of consumption across all food and beverages between 2011 and 2021 was 15 percent, steadily growing over the period.
Source: USDA
The Origins and Evolution of Organic Agriculture
The concept of organic agriculture was developed in the early 1900s by pioneers such as Franklin Hiram King, Rudolf Steiner, Robert Rodale, Sir Albert Howard, Eva Balfour, and others who believed that the use of animal feces (often made into organic fertilizer), cover crops, crop rotation, and biologically based pest control would lead to a better farming system. Their organic agriculture idea books were released in the 1920s, 1930s, and 1940s. The books gradually perfected and defined biological movement and organic agriculture.
As the actions of the pioneers expanded, a group of farmers in Europe and America began to grow in this direction. The organic producer model emerged in the 1940s and 1950s. In Europe, America, and Australia, the issue of inspection and supervision was raised and implemented, and organic standards and systems were established.
The proponent of the organic movement label was Rudolf Steiner, and it was likely the first organic label ever developed. In 1967, the Soil Association, with the help of Ms. Eva Balfour, published the world's first standards for organic agricultural production. In 1970, organic products were introduced to the world for the first time.
In the 1970s, various farm groups in the United States adopted the principles of organic agricultural production standards. Many organizations have created their own certification systems to ensure that organic products are produced in accordance with their requirements.
In the late 1970s and early 1980s, certification agencies grew and expanded beyond national boundaries. Many accreditation programs were developed, such as producer accreditation. Most of these organizations engaged in activities other than certification. In the mid-1980s, a number of specialized certification agencies were formed, such as SKAL (Netherlands), KRAV (Sweden), and FVO (USA). Finally, in 1990, with the birth of the regulation, Regulations in Europe on organic certification became a concern towards commercialization, and certification companies were born.
Certification agencies were developed, organic production standards and regulations were perfected, and the organic production movement grew worldwide. The International Federation of Organic Agriculture Movements (IFOAM) has established fundamental standards and an accreditation program that is recognized as a common international guide to its standards and certification systems. Countries can be built on organic production.
Organic production laws are currently in place. Organic production regulations were enacted in the US states of Oregon and California in 1970. In 1980, a variety of new organic products began to be introduced into Europe, and organic trade bodies in the United States expanded and soon crossed borders. In the United States, a law governing organic food production was enacted in 1990. Finally, the US Department of Agriculture established organic food regulations in December 2000, which went into effect in October 2000. 2002. In Europe, rule 2092/91 regulating organic foods was passed in 1991. Since 1992, countries have worked together to produce the Codex Alimentarius standard, which guides organic agriculture. Codex Alimentarius participates in the FAO/WTO mission on food standards. In 1999, the Codex Alimentarius rules for organic goods were adopted.
The global state of organic agriculture development
Organic farms grew substantially in most European countries during the 1990s. The overall area of organic production increased by 46.2% between 1988 and 1999. In recent years, Europe's total yearly organic area has expanded by an average of 30% per year. Three million hectares (survey data) were managed with more than 100,000 organic farms in numerous European nations at the beginning of the 2000s, accounting for up to 2% of agricultural land. Organic farming expanded from 830 farms in 1990 to 5,300 farms producing organic crops in 2000.
| Manufacturing nation | Area (ha) | Compared to % of production area | Organic fruit and vegetable growing area (ha) |
| England | 472500 | 2.5 | 3000 |
| Germany | 546023 | 3.2 | 7118 |
| Italy | 1040377 | - | - |
| France | 371000 | 1.3 | 27945 |
| Nederland | 27820 | 1.4 | 2100 |
| Belgium | 20663 | 0.9 | 612 |
| Austria | 272000 | 10.0 | - |
| Switzerland | 95000 | 9.0 | 1238 |
| Denmark | 165258 | 6.2 | 1912 |
| Sweden | 139000 | 5.1 | 2300 |
| America | 544000 | 0.2 | 41266 |
| Japan | 1000 | 0.02 | - |
Table 1: Area of organic tea production in 2000 (FAO 2001)
Market necessities
Organic product manufacturing continues to account for a very modest part of total food demand in the market. In most countries, the organic food market share is roughly 1% of absolute food sold. According to the results in the table below, Austria and Switzerland account for around 1.8 - 2%. Danish organic products account for 3% of the food in circulation.
| Nation | Year 2000 | Year 2010 | |||
| Value of sales in 2000 (million USD) | % rate in comparison to the market | TD annual increase (%) | Value of sales in 2010 (million USD) | TD Average annual increase (%) | |
| Germany | 2200 – 2400 | 1.25 – 1.5 | 10 - 15 | 5706-8900 | 10-15 |
| England | 1000 – 1050 | 1.0 | 25 – 30 | 9313-13786 | 25-30 |
| Italy | 1000 – 1050 | 1.0 | 15 – 20 | 4046-6192 | 15-20 |
| France | 750 – 800 | 1.0 | 15 – 20 | 3034-4644 | 15-20 |
| Switzerland | 425 – 450 | 2.0 – 2.5 | 15 – 20 | 1719-2631 | 10-15 |
| Denmark | 350 – 375 | 2.5 – 3.0 | 10 – 15 | 908-1416 | 10-15 |
| Austria | 250 – 300 | 2.0 | 10 – 15 | 648-1011 | 10-15 |
| Netherlands | 225 – 275 | 0.75 | 10 – 20 | 584-1393 | 10-20 |
| Sweden | 125 – 150 | 1.0 | 20 – 25 | 774-1164 | 20-25 |
| Other European countries | 300 – 400 | - | - | 778-1214 | 10-15 |
| America | 8000 | 1.5 | 15 – 20 | 32364-49534 | 15-20 |
| Japan | 300 | - | 15 – 20 | 778-1214 | 10-15 |
| Australia | 170 | - | - | 441-668 | 10-15 |
| New Zealand | 59 | - | - | 153-239 | 10-15 |
| Argentina | 20 | - | - | 52-81 | 10-15 |
| China | 12 | - | - | 31-49 | 10-15 |
| Taiwan | 10 | - | - | 26-40 | 10-15 |
| Philippines | 6 | - | - | 16-24 | 10-15 |
| Total | 15202 - 15827 | 10 | 15 – 20 | 61372-94220 | 15-20 |
Table 2: World markets for organic food and drinking water (FAO 2001)
With the demands of the organic market in Europe, America, and Japan, developing countries must direct production activity to meet these demands. According to the data in the table above, it is projected that organic food and beverage sales in 2010 increased the yearly organic market by 10-25% depending on the country. The organic food market was worth about 16 billion USD in 2000, and the global market is expected to be worth between 61 and 94 billion USD in 2010.
Reference source:
1. FAO
2. Dr. Le Van Hung - Department of Science and Technology, Ministry of Agriculture and Rural Development, Vietnam
3. Photo: Alamy, internet
We recognize that partners like you need as much technical information as possible to answer customer questions, reduce support cases, and increase partners' productivity.
Now you can achieve all these goals from the workshop "Reporting the results of using natural organic products Heart Of Nature to treat water environment."
Join us for two-day, instructor-led, and certified technical training!
Time 9:00 AM
Date: Dec 10th, 2022
Add: Park Hyatt Saigon, Viet Nam
9:00 AM :
Giới thiệu Chương trình sự kiện - Mr. Stevent (MC)
9:10 AM :
Tình trạng ô nhiễm môi trường nước thực tế
- M. Robert (Báo cáo viên Heart Of Nature)
9:30 AM :
.....
..... :
.....
Get Heart of Nature news first. Stay in touch with our latest updates and media releases